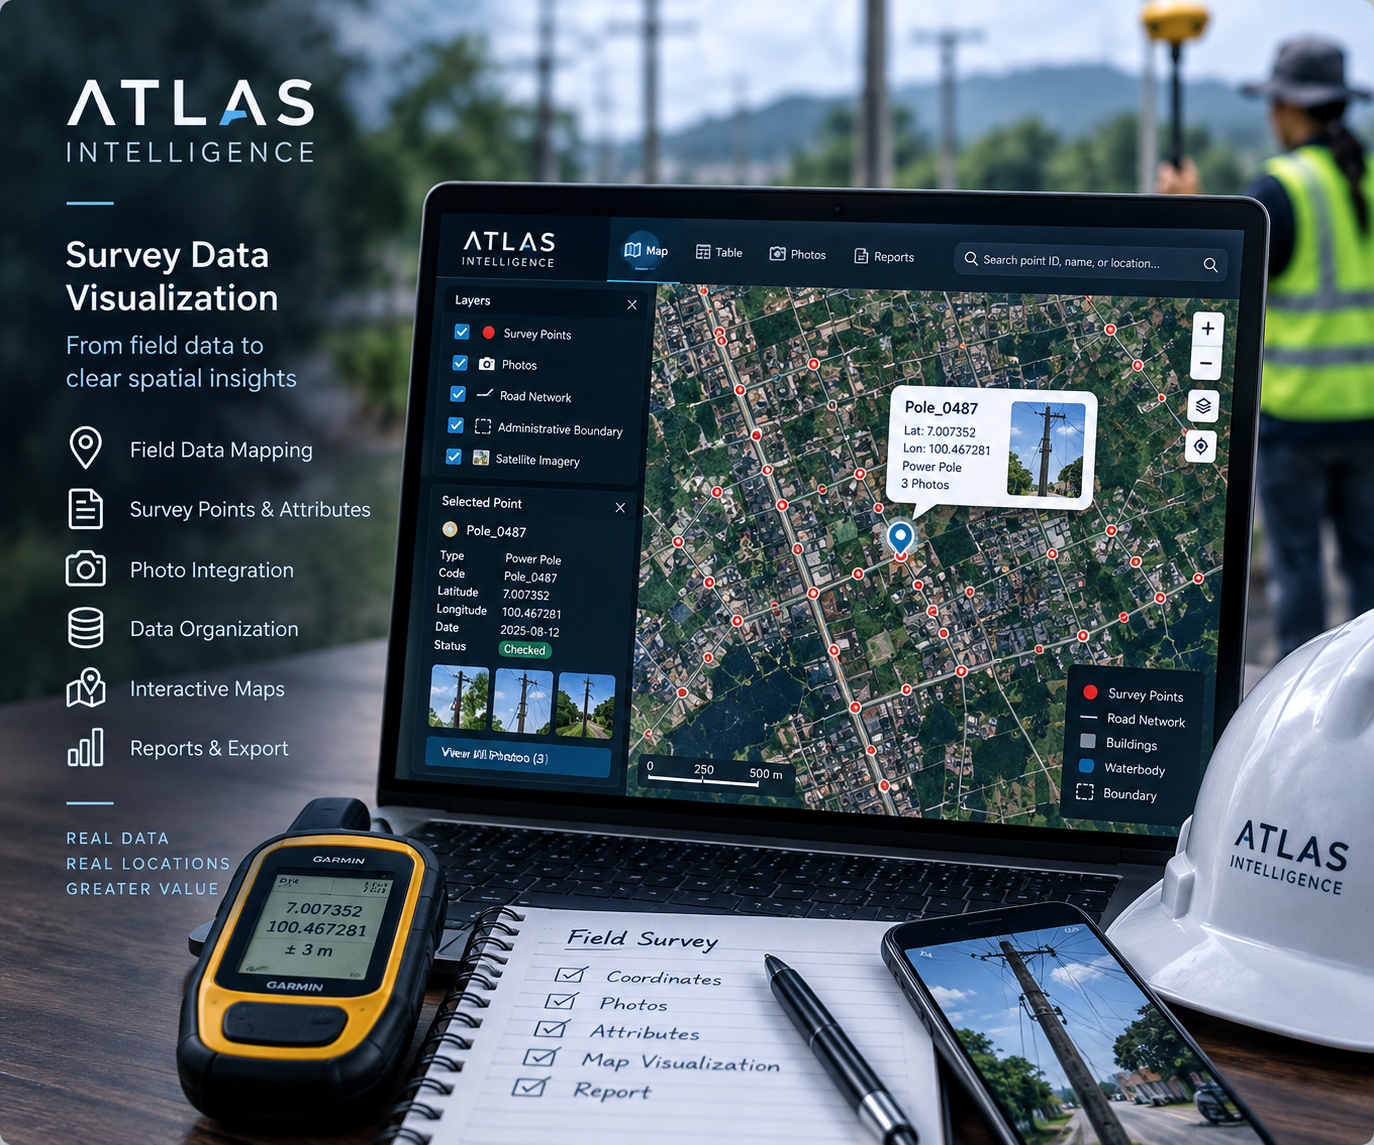
From Field Records to Usable Project Information
Fieldwork often produces separate spreadsheets, coordinate files, notes, and photo folders. We connect these records through consistent identifiers and map them in a structure your team can understand. The result is a clearer record of what was observed, where it was recorded, and which supporting evidence belongs to each location.
What We Organize and Visualize
Survey Points and Coordinates
Display measured or recorded points with meaningful labels and agreed attributes. We review coordinate formats and the stated coordinate reference system, and flag missing values, duplicate identifiers, or obvious location inconsistencies for your team to resolve.
Field Photos and Observation Records
Link photographs, inspection notes, dates, and categories to the correct point or asset. Structured records help reviewers compare site conditions and retrieve evidence without searching through disconnected folders.
Asset Inventories and Field Progress
Use clear map symbols to distinguish asset types, inspection status, or project categories. This can support utility inventories, infrastructure inspections, environmental observations, and field verification of candidate locations.
Deliverables Built Around Your Workflow
The agreed package may include a cleaned attribute table, organized GIS layers, labeled map layouts, KML/KMZ files for Google Earth, and a data dictionary explaining the fields. A searchable map with photo popups can be included where appropriate. We confirm output formats, photo delivery, and record volume before work begins.
How We Prepare Your Field Data
01 — Review the Files and Requirements
Share your point list, coordinate reference information, attribute tables, photographs, and intended use. We assess how the files connect and agree the identifiers, categories, output formats, and review criteria.
02 — Structure and Check the Records
We standardize field names and formats, match records by identifier, and document unresolved issues. Checks focus on data organization and consistency; the precision and provenance of measurements remain dependent on the original field collection.
03 — Build the Visualizations
We create readable symbols, labels, legends, and record views. Photo references and relevant notes are attached to the corresponding locations, with information prioritized for the people reviewing the project.
04 — Validate and Hand Over
We compare sample records with your source files, check photo associations and output compatibility, and share a draft for review. Final delivery includes the agreed map files and guidance for navigating or updating the records.
When This Service Is Useful
Use this service to communicate point surveys, organize utility or facility records, present site inspection findings, or compare field observations with an analysis model. It helps project managers and clients inspect the evidence behind each mapped location.
For a browser-based interface with search and layers, explore Interactive Web Maps & Data Visualization. If your project also requires proximity calculations, spatial comparisons, or thematic analysis, see GIS & Spatial Analysis.
Frequently Asked Questions
Which files can I send?
A CSV or spreadsheet with a unique point code and coordinates is a practical starting point. Existing GIS layers, KML/KMZ files, and photos named or indexed by point code are also useful. Tell us the coordinate reference system and units if known; unclear spatial references must be resolved before reliable mapping.
Does this service include collecting new survey data?
This service focuses on organizing and visualizing data you already have. New field collection, measurement verification, and specialist survey work require a separately agreed scope. A map visualization does not establish legal boundaries or certify survey accuracy.
Can I find a point by code and view its photos?
Yes, a searchable record view or web map can be scoped around your point identifiers and photo links. We agree how photos will be stored and shared, and avoid including confidential records in public deliverables.
Can field evidence support site selection?
Mapped observations can help document access, surroundings, and site conditions. For comparing investment locations using wider market and geographic factors, explore Location Intelligence & Site Selection.
Ready to Organize Your Survey Data?
Tell us the number of points, available file formats, photo structure, and intended audience. We will help define a practical visualization package for your field records.